Motivation
In the tutorial “Scrape the Web”, we constructed a database table of airport locations. This is an example of geo-coded data: each row of the table has a latitude and longitude and there is a data attribute, “Airlines”, which suggests the size of the airport. We would like to visualize these data on a map.
Design Choice
R has powerful plotting tools unified through the ggplot2 package. So you could develop expertise in these tools and use them for plotting geographical data. But there is also the leaflet package which encapsulates the javascript Leaflet library. This is a simple and versatile tool that has become our tool of choice for visualizing geo-coded data. This tutorial will use leaflet.
Load the Relevant Packages
Use the code below to load the packages we will need for this tutorial.
loadPkg <- function(pkgname){
  # require() is the same as library() but returns a logical.
  # character.only= TRUE means pkgname is the name of the package.
  isInstalled <- require(pkgname,character.only = TRUE)
  # If the package has not been installed yet, then install and try again.
  if (!isInstalled) {install.packages(pkgname); library(pkgname,character.only=TRUE)}
}
# We will need the following libraries
loadPkg("DBI")
loadPkg("RSQLite")
loadPkg("stringr")  # for the str_c() function
loadPkg("leaflet")  # for map display
loadPkg("htmltools")  # To prettify the map title
Prepare the Data for Display
Suppose we want to display a circle on a map for each large airport in France (country code “FR”) and make the radius of the circle proportional to the number of airlines served by that airport. We have a little bit of data wrangling to do because some entries are missing the airlines data (they show value “NA”) and we may want to scale the number of airlines to control the circle size. The following function is a generic function to accomplish this. It has two tunable parameters, defaultAirlines and scalefactor, with default values 1 and 1, respectively.
displayCountryAirports <- function(countrycode,defaultAirlines=1,scalefactor=1){
# Form the database query
query <- str_c("SELECT * FROM airports WHERE country='",countrycode,"'") # Note the single quotes around countrycode
#print(query) # Uncomment this for debugging
# Open a connection to the database
conn <- dbConnect(RSQLite::SQLite(),"data/sandboxdata.db")
# Execute the query
result <- dbGetQuery(conn,query)
# Close the connection
dbDisconnect(conn)
print(result)
}
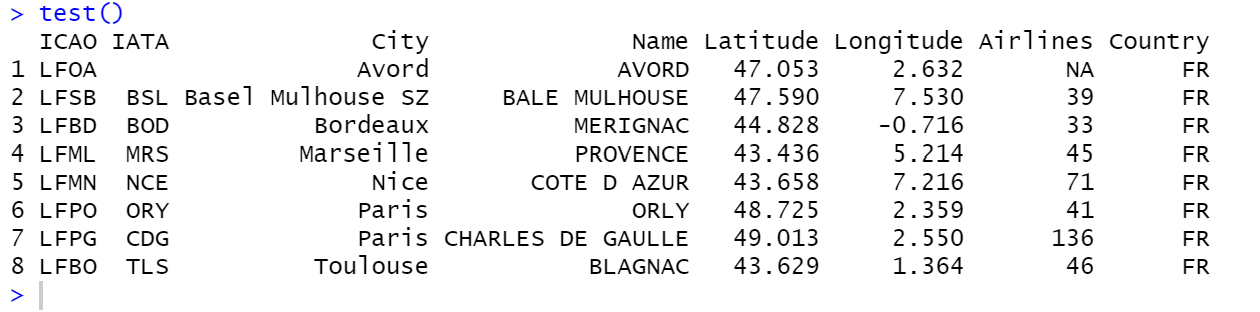
test <- function(){
countrycode <- "FR"
displayCountryAirports(countrycode)
}Execute this script and then enter “test()” in the console window. You should see the following.
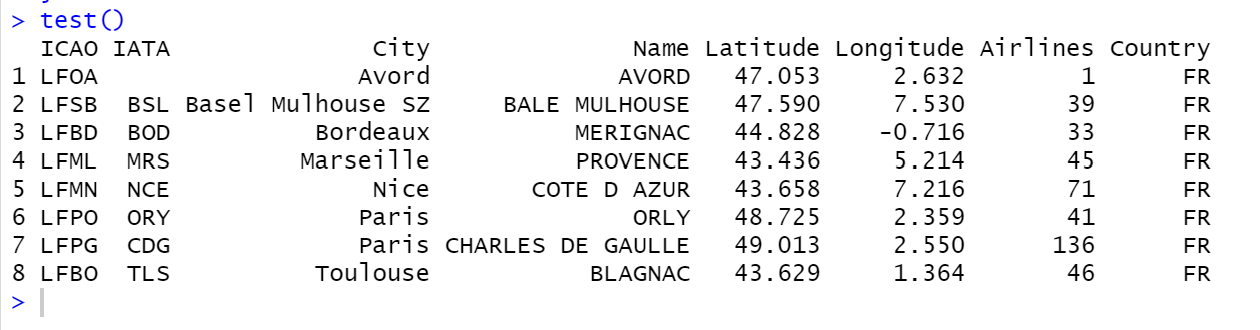
We add code to replace “NA” with a default number of airlines and introduce a column with a scaled number of airlines. Replace the function displayCountryAirports() with this code
displayCountryAirports <- function(countrycode,defaultAirlines=1,scalefactor=1){
  # Form the database query
  query <-  str_c("SELECT * FROM airports WHERE country='",countrycode,"'") # Note the single quotes around countrycode
  #print(query)  # Uncomment this for debugging
  # Open a connection to the database
  conn <- dbConnect(RSQLite::SQLite(),"data/sandboxdata.db")
  # Execute the query
  result <- dbGetQuery(conn,query)
  # Close the connection
  dbDisconnect(conn)
  result$Airlines[is.na(result$Airlines)] <- defaultAirlines
  result$Airlines <-  result$Airlines*scalefactor
  print(result)
}
Check: after executing the script, enter “test()” in the console window. This should be the result:
Create a Map and Add Circles
The leaflet object leaflet() can be used to create map objects. When you execute a map object from an R script, it will display the map in the viewer window of your RStudio interface.
displayCountryAirports <- function(countrycode,defaultAirlines=1,scalefactor=1){
# Form the database query
query <- str_c("SELECT * FROM airports WHERE country='",countrycode,"'") # Note the single quotes around countrycode
#print(query) # Uncomment this for debugging
# Open a connection to the database
conn <- dbConnect(RSQLite::SQLite(),"data/sandboxdata.db")
# Execute the query
result <- dbGetQuery(conn,query)
# Close the connection
dbDisconnect(conn)
result$Airlines[is.na(result$Airlines)] <- defaultAirlines
result$Airlines <- result$Airlines*scalefactor
print(result)
# Create the map
map <- leaflet()
# Add the background tiles (the default is to source the tiles from OpenStreetMap)
map <- addTiles(map)
# Add circles and connect the attributes in the data to display parameters of circles
map <- addCircles(map,lng=~Longitude,lat=~Latitude,radius=~Airlines,data=result,popup=~City)
# Display the map
map
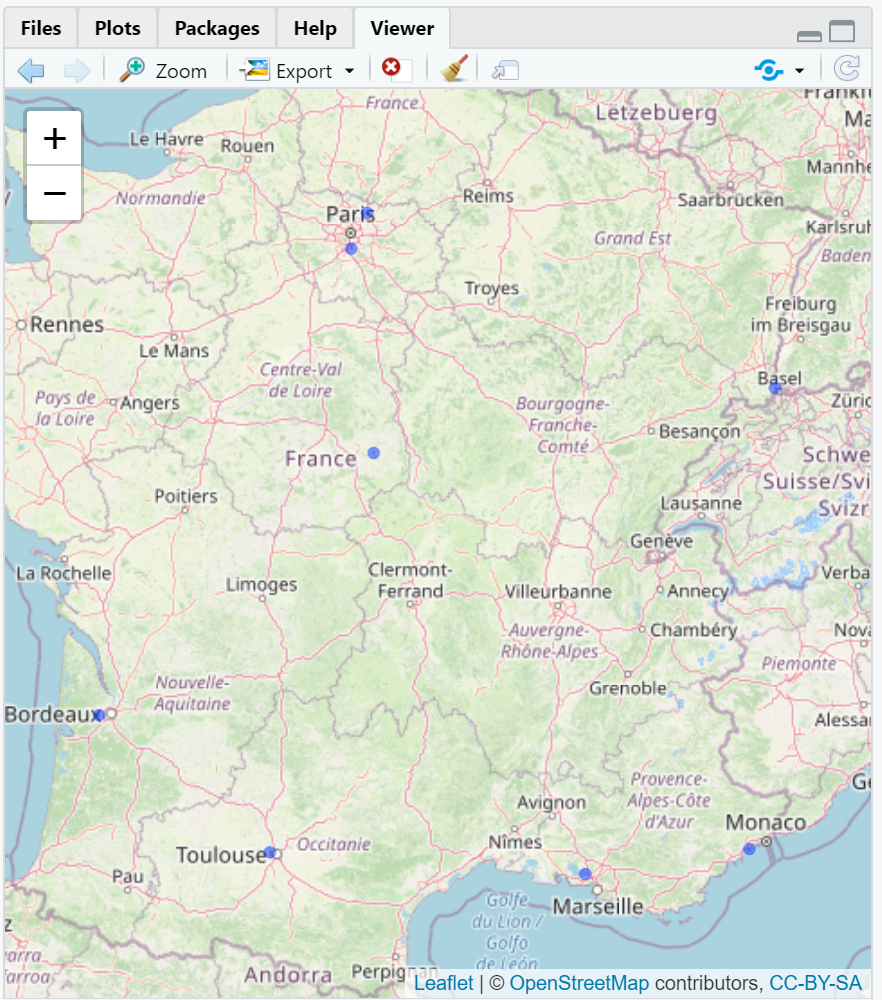
}Observe that in the addCircles() function, the data provided is given by our result data frame. The columns “Latitude” and “Longitude” are supplied to the “lat” and “lng” parameters, the “Airlines” column is provided to the “radius” parameter, and the “City” column is provided to the “popup” parameter.
Enter the following command in the console window: displayCountryAirports("FR"). The result should appear in the Viewer window.
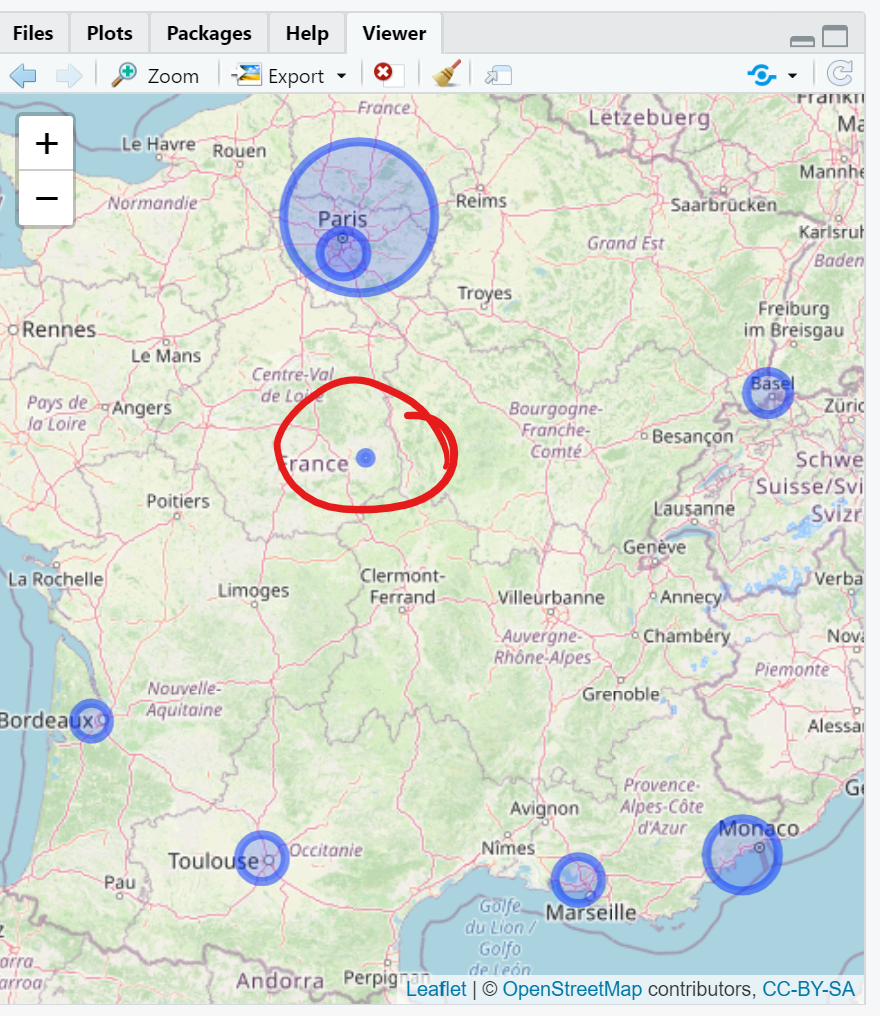
The circles are rather small, but that is why we included the scalefactor. Try: displayCountryAirports("FR",1,500)
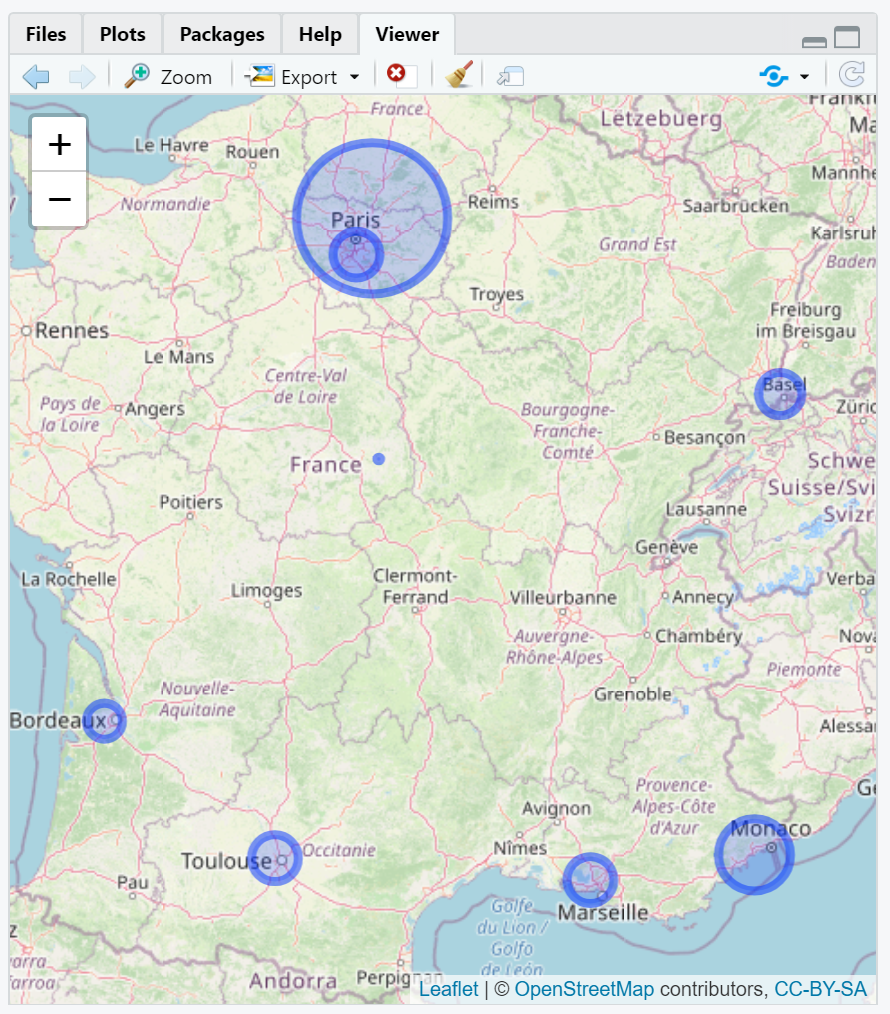
That’s better but the AVORD airport is hard to see. Set the default number of airlines to 10: displayCountryAirports("FR",10,500)
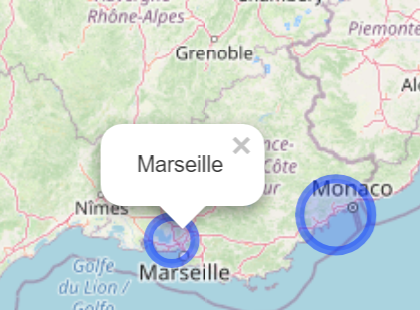
Now AVORD is a little more visible. Experiment with the popup feature by clicking on one of the circles. For example:
Pipes and Titles
Leaflet supports piping, so we can make our code less verbose:
displayCountryAirports <- function(countrycode,defaultAirlines=1,scalefactor=1){
  # Form the database query
  query <-  str_c("SELECT * FROM airports WHERE country='",countrycode,"'") # Note the single quotes around countrycode
  #print(query)  # Uncomment this for debugging
  # Open a connection to the database
  conn <- dbConnect(RSQLite::SQLite(),"data/sandboxdata.db")
  # Execute the query
  result <- dbGetQuery(conn,query)
  # Close the connection
  dbDisconnect(conn)
  result$Airlines[is.na(result$Airlines)] <- defaultAirlines
  result$Airlines <-  result$Airlines*scalefactor
  print(result)
  # Create the map
  map <- leaflet() %>%
  # Add the background tiles (the default is to source the tiles from OpenStreetMap)
         addTiles() %>%
  # Add circles and connect the attributes in the data to display parameters of circles
         addCircles(lng=~Longitude,lat=~Latitude,radius=~Airlines,data=result,popup=~City)
  # Display the map
  map
}
Making a nice map title is a little more involved. We need to create an HTML style tag first.
# tags is an object in htmltools: allows us to define HTML styles
tag.map.title <- tags$style(HTML("
.leaflet-control.map-title {
transform: translate(-50%,0%);
position: fixed !important;
left: 50%;
text-align: center;
padding-left: 10px;
padding-right: 10px;
background: rgba(255,255,255,0.75);
font-weight: bold;
font-size: 16px;
}
"))
displayCountryAirports <- function(countrycode,defaultAirlines=1,scalefactor=1){
# Form the database query
query <- str_c("SELECT * FROM airports WHERE country='",countrycode,"'") # Note the single quotes around countrycode
#print(query) # Uncomment this for debugging
# Open a connection to the database
conn <- dbConnect(RSQLite::SQLite(),"data/sandboxdata.db")
# Execute the query
result <- dbGetQuery(conn,query)
# Close the connection
dbDisconnect(conn)
result$Airlines[is.na(result$Airlines)] <- defaultAirlines
result$Airlines <- result$Airlines*scalefactor
print(result)
# Create the title using the special styling
title <- tags$div(tag.map.title, "Large Airports in France" )
# Create the map
map <- leaflet() %>%
# Add the background tiles (the default is to source the tiles from OpenStreetMap)
addTiles() %>%
# Add circles and connect the attributes in the data to display parameters of circles
addCircles(lng=~Longitude,lat=~Latitude,radius=~Airlines,data=result,popup=~City) %>%
# Add title using style with classname "map-title"
addControl(title, position = "topleft", className="map-title")
# Display the map
map
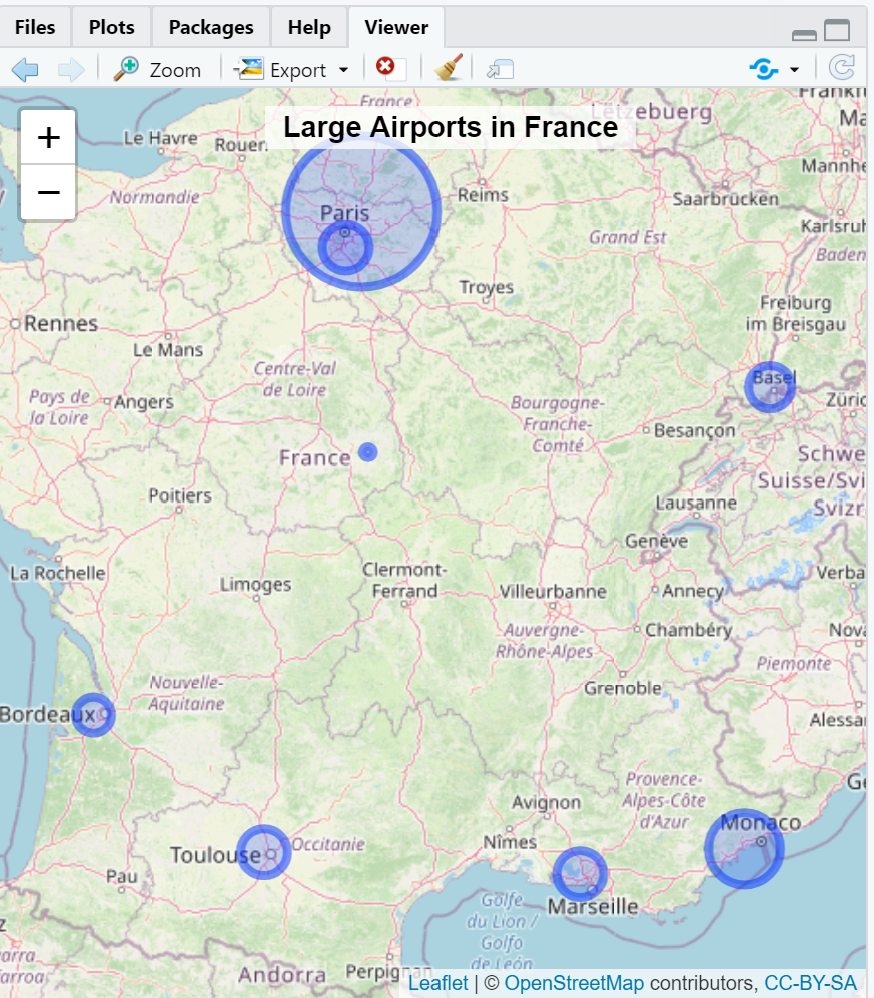
}Execute this script and then enter displayCountryAirports("FR",10,500), as before.
We show another use for leaflet in the “Animate Geographical Data” session.
Summary
- Use the SQL SELECT command to select data from your database to display.
- If the data is geo-coded (with latitude and longitude) then you can use the
leafletpackage. - Displaying your data is as simple as adding tiles,
addTiles(), and adding circles mapped to the data,addCircles(). - Leaflet supports piping.
- You can add a title to your map with the help of styling tags from
htmltools.