Motivation
In the tutorial “Capture Live Data”, we captured data from the Open Sky Network website at 1 minute intervals. We would like a way to display the data for individual time stamps, but animate the display so we can see aircraft movements. One approach would be take snapshots of the individual maps and then merge them into a movie file. That is a little difficult. An easier approach is to use R Shiny which can serve webpages to your browser. We can use a slider bar in the browser window to access the maps for different time stamps. This can have the appearance of an animation.
Packages We Will Need
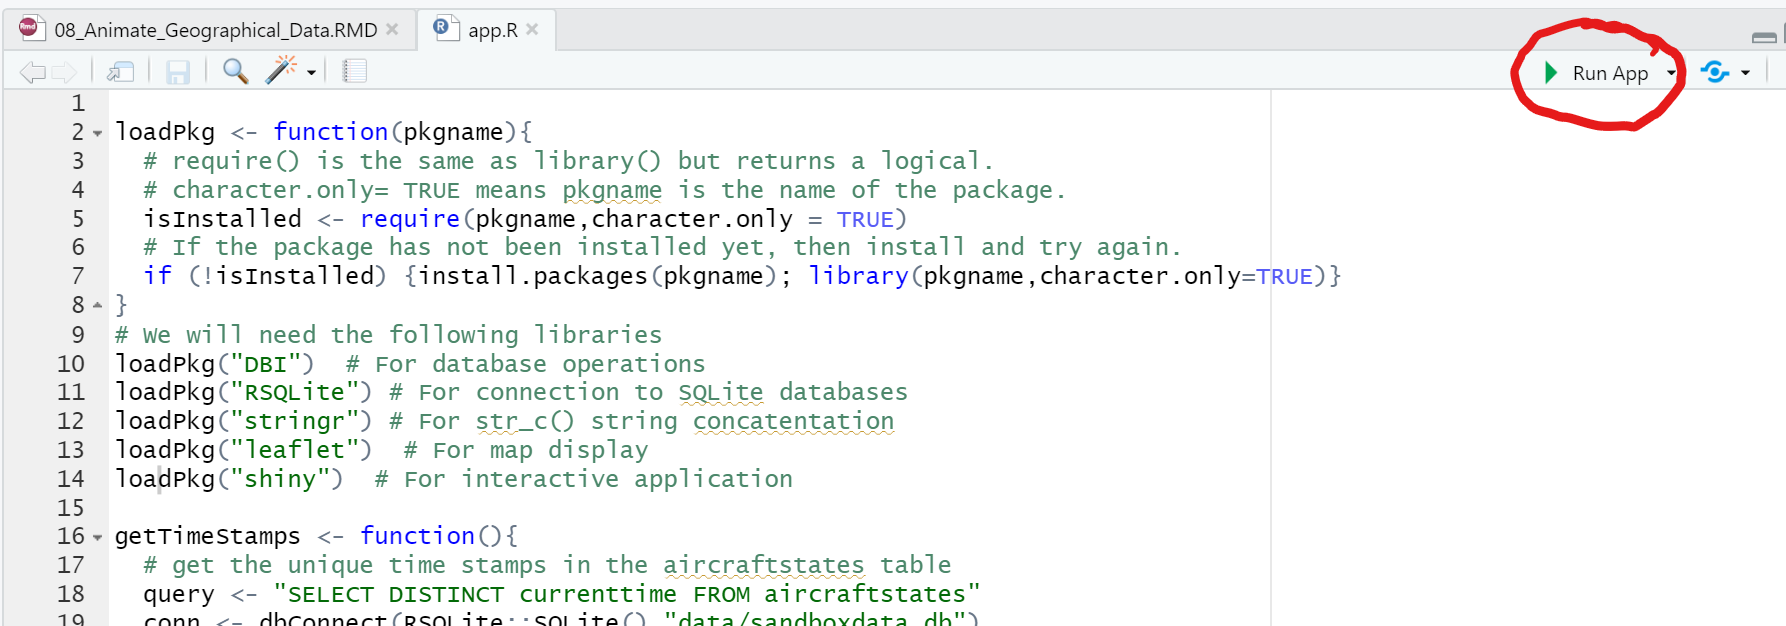
Create a file called “app.R” in your sandbox directory. The initial code in this script should load the packages we will need.
loadPkg <- function(pkgname){
  # require() is the same as library() but returns a logical.
  # character.only= TRUE means pkgname is the name of the package.
  isInstalled <- require(pkgname,character.only = TRUE)
  # If the package has not been installed yet, then install and try again.
  if (!isInstalled) {install.packages(pkgname); library(pkgname,character.only=TRUE)}
}
# We will need the following libraries
loadPkg("DBI")  # For database operations
loadPkg("RSQLite") # For connection to SQLite databases
loadPkg("stringr") # For str_c() string concatentation
loadPkg("leaflet")  # For map display
loadPkg("shiny")  # For interactive application
Database Functions
The SQLite database “data/sandboxdata.db” was created in earlier tutorials. Here we write functions to get a list of the time stamps in the aircraftstates table and, based on a time stamp, get aircraft states for that time stamp.
getTimeStamps <- function(){
  # get the unique time stamps in the aircraftstates table
  query <- "SELECT DISTINCT currenttime FROM aircraftstates"
  conn <- dbConnect(RSQLite::SQLite(),"data/sandboxdata.db")
  result <- dbGetQuery(conn,query)
  # Close the connection.
  dbDisconnect(conn)
  # Return the result
  result
}

getAircraftStates <- function(timestamp){
  # Get a connection to our SQLite database
  query <- "SELECT DISTINCT icao24,callsign,origin_country,longitude,latitude,currenttime FROM aircraftstates"
  query <-  str_c(query,"WHERE currenttime=",timestamp,sep=" ")
  conn <- dbConnect(RSQLite::SQLite(),"data/sandboxdata.db")
  result <- dbGetQuery(conn,query)
  # Close the connection.
  dbDisconnect(conn)
  # Return the result
  result
}
Create Some Globally Available Variables
We will create two variables that are available to subsequent functions: timestamps, a data frame of time stamps present in the database, and tag.map.title, a style setting for the map title.
timestamps <- getTimeStamps()


# Special CSS formatting for the map title
tag.map.title <- tags$style(HTML("
  .leaflet-control.map-title {
    transform: translate(-50%,0%);
    position: fixed !important;
    left: 50%;
    text-align: center;
    padding-left: 10px;
    padding-right: 10px;
    background: rgba(255,255,255,0.75);
    font-weight: bold;
    font-size: 18px;
  }
"))
Define the User Interface
There are two components to an R Shiny application: the user interface (UI) and the server. With the UI, you describe the text and widgets that will appear on the webpage and the general layout. fluidPage() provides an easy way to lay out objects on the page.
# Define UI for application that animates a map
ui <- fluidPage(

    # Application title
    titlePanel("Open Sky Network Data"),

    #Divide the page in two: sidebar panel will contain slider; main panel will contain map.
    sidebarLayout(
        sidebarPanel(
           # slider input for an index into the data frame of time stamps
            sliderInput("timestampindex",
                        "Timestamp:",
                        min = 1,
                        max = nrow(timestamps),
                        step=1,
                        value = 1)
        ),
        mainPanel(
          # Show a leaflet map
          leafletOutput("map1",height="300px")
        )
    )
)
Define the Server
The server controls the interactivity of the webpage. When an input widget like a slider bar changes, the server will react and update one of the output widgets.
# Define server logic required to display and animate the map
server <- function(input, output) {

    output$map1 <- renderLeaflet({ # this is only executed once: when the page loads
      leaflet() %>%  addTiles() %>%
        # Center the view in the middle of France and choose an appropriate zoom level
        setView(lng=2,lat=47,zoom=5)
      })

    observe({ # This will activate when the slider bar changes value (input$timestampindex)
      # Get the value of the slider bar
      tsindex <- input$timestampindex
      # Use the value to look up a time stamp
      timestamp <- timestamps$currenttime[tsindex]
      # Get the aircraft states for this timestamp
      dfAircraftStates <- getAircraftStates(timestamp)
      # Convert unix time stamp to R date object
      timestamp <- as.POSIXct(timestamp, origin = "1970-01-01")
      # Use the date time as the title
      title <- tags$div(tag.map.title, HTML(as.character(timestamp)) )
      # The leaflet map already exists, so use leafletProxy to access it
      leafletProxy("map1") %>%
        clearShapes() %>%  # Clear out the circles if any
        addCircles(lng=~longitude,lat=~latitude,radius=10,data = dfAircraftStates) %>%
        addControl(title, position = "topleft", className="map-title")
    })
}
Add Code to Launch the application
# Run the application
shinyApp(ui = ui, server = server)
Run the App
Save your file and then click the “Run App” button in the upper right of the script file.
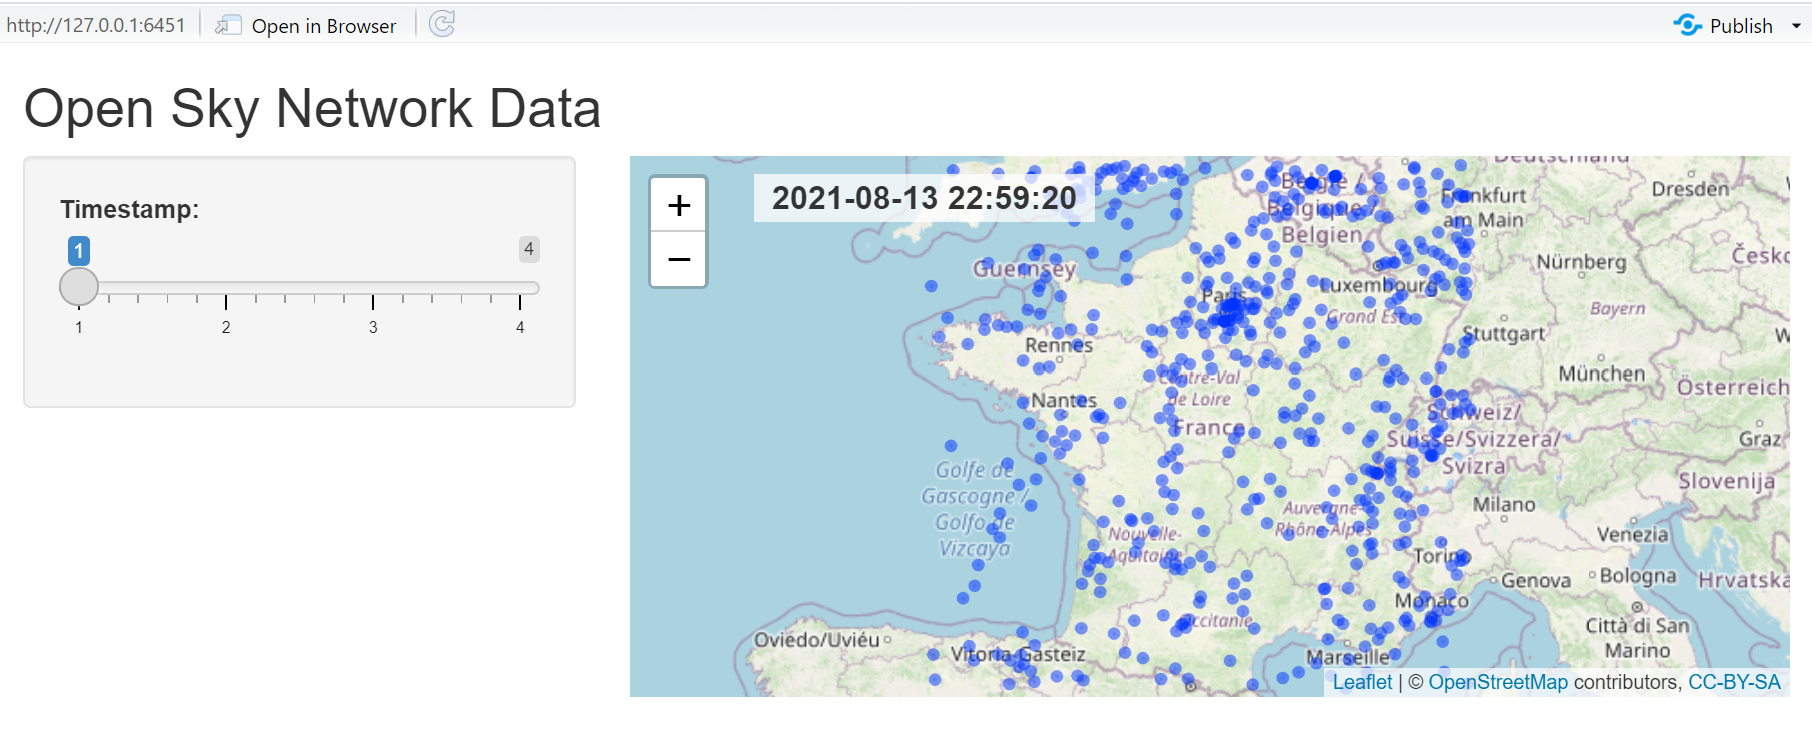
This should launch a viewer with an interactive application. When you change the slider bar, the map display should respond by displaying the data for the corresponding time stamp.
Summary
- R Shiny acts a server capable of delivering web pages to your browser.
- R Shiny provides a variety of input widgets such as slider bars and output widgets such as plots, tables, and leaflet maps.
- You can view your data interactively with an R Shiny interface.