Class Diagram
One of the diagram types which Capella has adopted from the Unified Modeling Language (UML) is the Class Diagram. Class Diagrams are used extensively in modeling information systems. They can be useful in more general systems architecture models by allowing data and terminology to be modeled precisely. All entities created in a Class Diagram are stored in the Data folder of the model. We did not include a data model for the Toy Catapult example for simplicity and because the toy was intended to be purely mechanical. Nevertheless, we would like to find some way to expose you to this diagram type.
In teaching design thinking approaches, we have found three diagram types to be useful in the early stages of a design project: the Context Diagram, the Concept Classification Diagram, and the Influence Diagram. All three of these diagram types can be created in Capella using the more general Class Diagram. In this short tutorial, we will give an example of each and explain briefly how they were created. There is really nothing for you to do in this tutorial: use it as a reference.
-
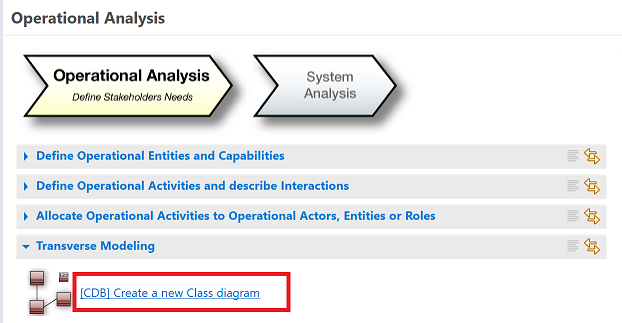
In every phase of a Capella model, you can create Class Diagrams by clicking [CDB] Create a new Class Diagram in the
Transverse Modeling section of the workflow.
-
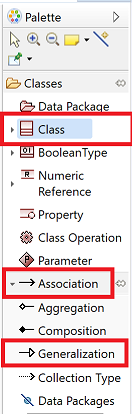
The Palette has lots of tools but all of the diagrams in this section were created using only the Class,
Association, and Generalization tools.
-
The first diagram we find useful is a Context Diagram. In a context diagram, the system of interest is placed at the center
of the diagram and the stakeholders (actors) and other entities are placed around it. Relationships between the system and these surrounding entities
are indicated with rectilinear lines with verb phrases.
 For example, we read in this diagram that "The Child retrieves the toy catapult from storage and plays with it." The importance of the context
diagram is that it identifies interfaces between the system of interest and the contextual world around it. Thinking about those interfaces often
gives rise to important system requirements. As you develop your design, you will discover more and more external entities to which your system is related.
You should continue to capture those relationships. The context diagram is a great place to keep track of them.
For example, we read in this diagram that "The Child retrieves the toy catapult from storage and plays with it." The importance of the context
diagram is that it identifies interfaces between the system of interest and the contextual world around it. Thinking about those interfaces often
gives rise to important system requirements. As you develop your design, you will discover more and more external entities to which your system is related.
You should continue to capture those relationships. The context diagram is a great place to keep track of them.
-
The structure of the context diagram is easy to create. Just add classes for each entity using the Class tool and connect
them using the Association tool. The only trick is in getting the verb phrase into a label on the connector.
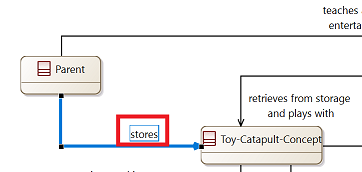 Here you see the connector from the Parent class to the Toy-Catapult-Concept class selected. The label on
the connector is stores. Here is the Properties view that accomplished that:
Here you see the connector from the Parent class to the Toy-Catapult-Concept class selected. The label on
the connector is stores. Here is the Properties view that accomplished that:
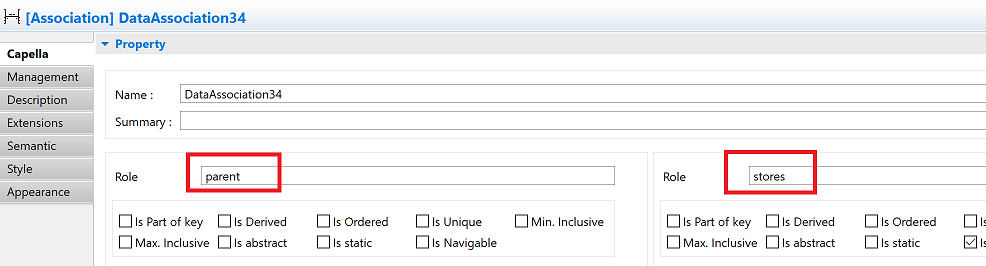 Observe that we didn't bother to name the association: we accepted the default name ("DataAssociation34").
Also observe that there are two roles for every association. Presumably, one role is for
the source class and the other role is for the target class. In practice, we had to use trial and error to figure out which role would result in
a label appearing on the diagram. Here it is clear that the role on the right, which we named stores resulted in the correct label.
Observe that we didn't bother to name the association: we accepted the default name ("DataAssociation34").
Also observe that there are two roles for every association. Presumably, one role is for
the source class and the other role is for the target class. In practice, we had to use trial and error to figure out which role would result in
a label appearing on the diagram. Here it is clear that the role on the right, which we named stores resulted in the correct label.
-
The second diagram we find useful is a Classification Tree Diagram. Brainstorming sessions result in many concepts. It is often useful to
organize the concepts into a classification tree. Another use is to keep track of the major decisions that were made in arriving at a final
design choice. That is what we illustrate here. We show a progressive set of choices ending with our final design decision: to go with a
Trebuchet-style toy catapult.
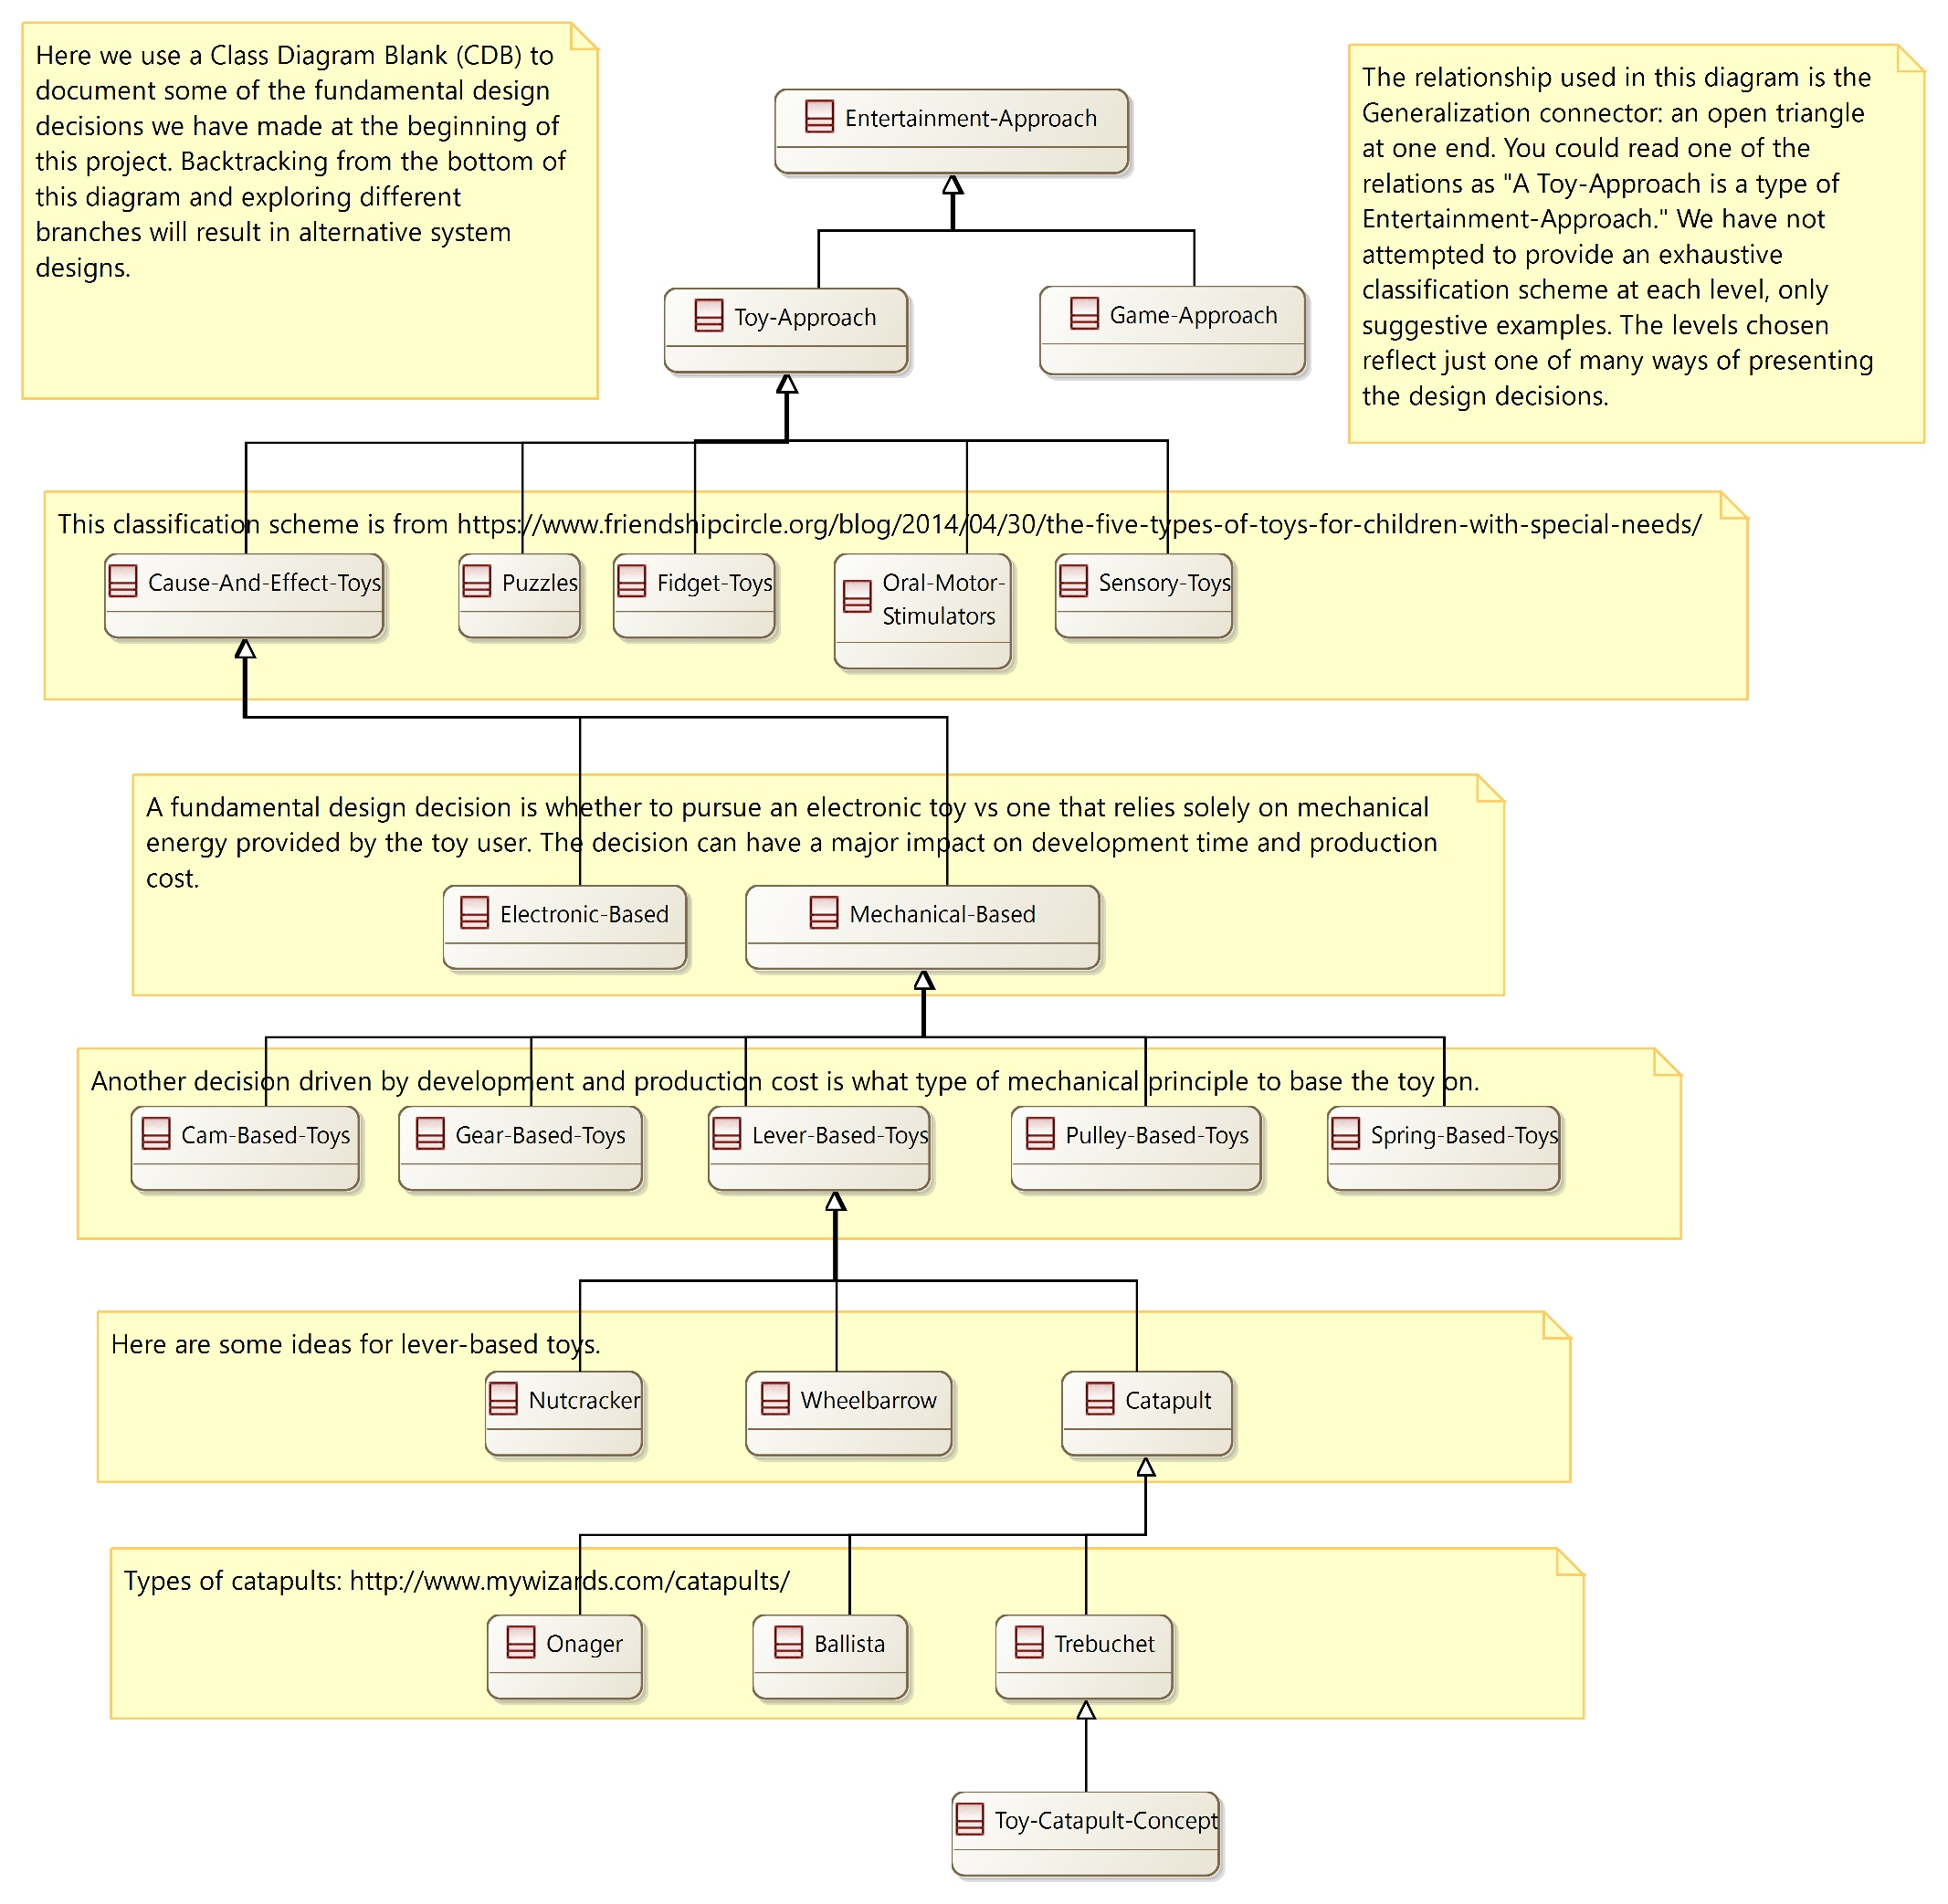 If we run into difficulties with our design, we may want to backtrack up this tree and try a different branch leading to a different design concept.
- The structure of this Classification Tree Diagram was created using the Class tool for the concepts and the Generalization tool for the branches. We styled them as rectilinear lines. We also used the Note tool to create the textual notes, moving them backward below the lines and classes, to create a sense of organization.
-
The third diagram type we find useful is an Influence Diagram. Here we create a node capturing some desirable attribute of the contextual
world and then capture how other quantities or qualities influence that desirable attribute. There are two flavors of the diagram,
one reflecting the "As Is" state of the world and the other reflecting what we hope our design will achieve, the "To Be" state of the world. Here is an "As Is"
diagram where we reflect on what it takes to delight a child.
 Here we read that our goal of "Entertainment-Pleasure" can be provided by "Narrative, Humour, Challenge, Anticipation, and/or Sensory Stimulation." We do
a deeper dive on this line of thinking and see that "Personality" can contribute to a "Narrative", and so on. The diagram is meant to be suggestive of ways
in which we can intervene and provide value.
Here we read that our goal of "Entertainment-Pleasure" can be provided by "Narrative, Humour, Challenge, Anticipation, and/or Sensory Stimulation." We do
a deeper dive on this line of thinking and see that "Personality" can contribute to a "Narrative", and so on. The diagram is meant to be suggestive of ways
in which we can intervene and provide value.
- To create this diagram, we used the same techniques as described above for the Context Diagram, except that we styled the lines as oblique rather than rectilinear.
-
Finally, we cloned the "As Is" Influence Diagram and added a node representing our proposed intervention, the Toy-Catapult-Concept.
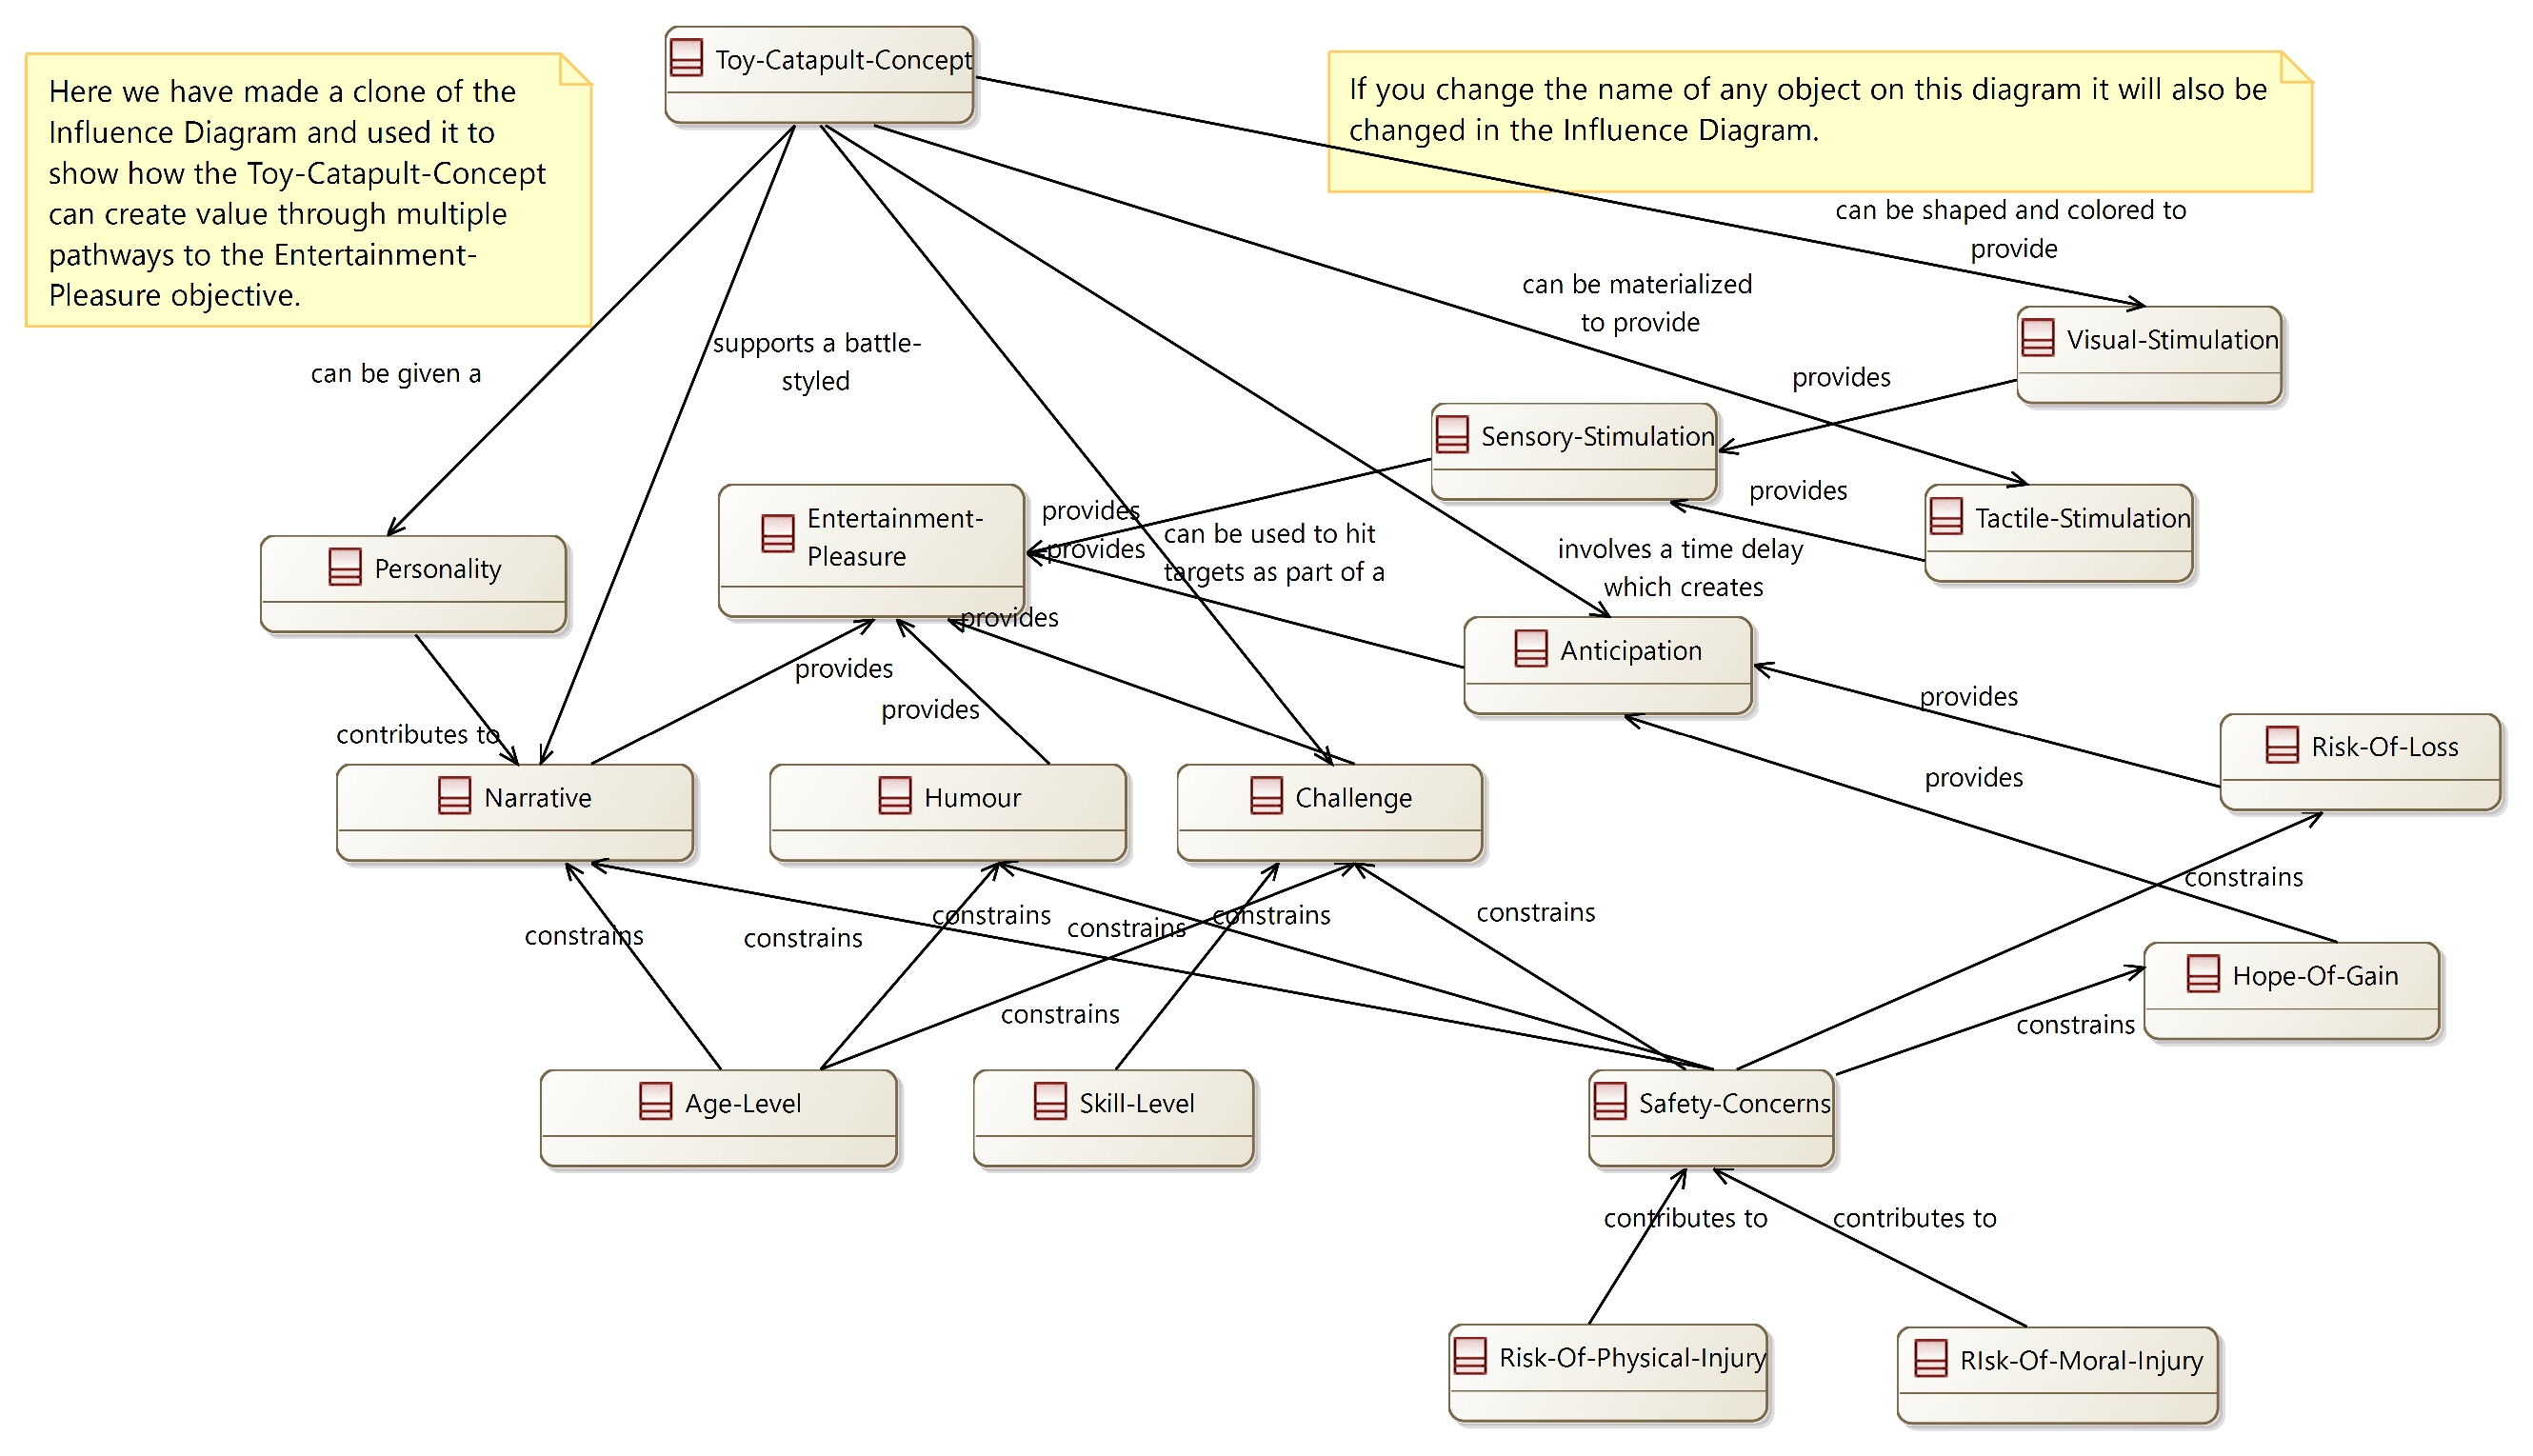 You can read this diagram to see that the toy catapult can lead to "Entertainment-Pleasure" because it supports a battle-themed narrative, it can be
given a personality (just paint eyes on it) to support the narrative, it can be used to hit targets as part of a challenge, it involves a time delay
(from loading to triggering) that
creates anticipation, it can be materialized to provide tactile stimulation (use nice materials), and finally, it can be shaped and colored to provide visual stimulation.
This is the beginning of a value proposition for the toy.
You can read this diagram to see that the toy catapult can lead to "Entertainment-Pleasure" because it supports a battle-themed narrative, it can be
given a personality (just paint eyes on it) to support the narrative, it can be used to hit targets as part of a challenge, it involves a time delay
(from loading to triggering) that
creates anticipation, it can be materialized to provide tactile stimulation (use nice materials), and finally, it can be shaped and colored to provide visual stimulation.
This is the beginning of a value proposition for the toy.